June 25, 2013, 8:04 p.m. by Rosalind Team
Topics: Bioinformatics Tools, NGS
Quality Prevails
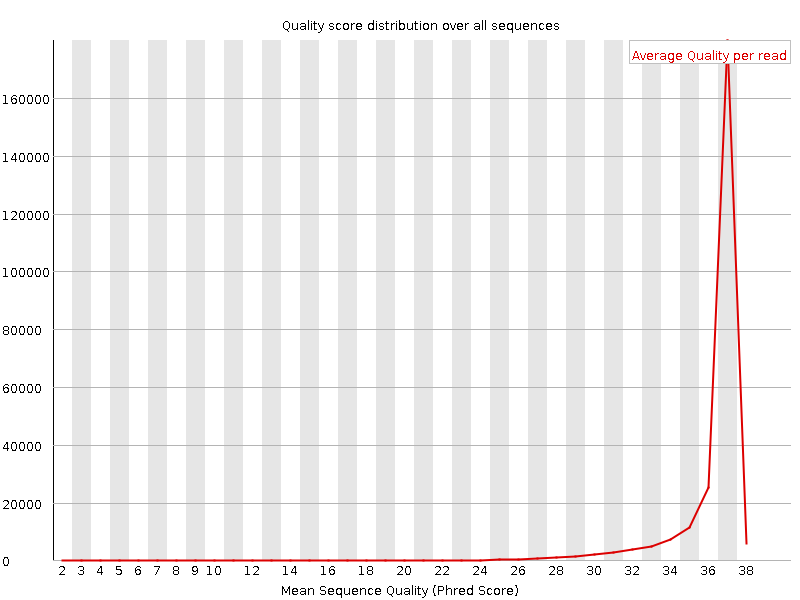
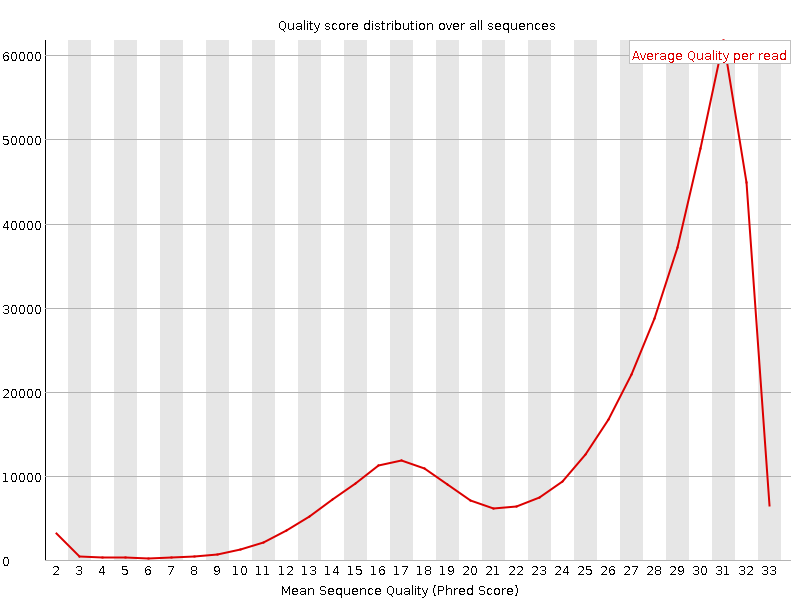
Figure 1. Per sequence quality scores - good dataFigure 2. Per sequence quality scores - bad dataOne of the first steps in the analysis of sequencing data is quality control. Unusual characteristics of the data may indicate problems in an earlier step, such as sample preparation, that must be corrected to obtain valid data.
The simplest metric to consider is the Phred quality score, introduced in “FASTQ format introduction”. Since the FASTQ files containing Phred scores are flat and quite large (up to tens of gigabytes), special tools have been created for working with them.
Since a sequencing run can produce thousands or millions of reads, we are less interested in the quality scores for any particular read and instead want to examine the quality characteristics of the run as a whole. One common metric at this level is the per-read quality score distribution. The average quality of each read is calculated, and the distribution of these average scores can be plotted and analyzed.
In Figure 1 one can observe that most reads in a good sequencing run have an average quality near 32. Figure 2 is an example of bad dataset.
One progam for quality control of bulk sequence read data is FastQC, developed by Babraham Bioinformatics. It provides graphs and tables for quick quality assessment.
A version of FastQC can be downloaded here and run locally on any operating system with a suitable Java Runtime Environment (JRE) installed.
An online version of FastQC is also available here in the "Andromeda" Galaxy instance.
Given: A quality threshold, along with FASTQ entries for multiple reads.
Return: The number of reads whose average quality is below the threshold.
28
@Rosalind_0041
GGCCGGTCTATTTACGTTCTCACCCGACGTGACGTACGGTCC
+
6.3536354;.151<211/0?::6/-2051)-*"40/.,+%)
@Rosalind_0041
TCGTATGCGTAGCACTTGGTACAGGAAGTGAACATCCAGGAT
+
AH@FGGGJ<GB<<9:GD=D@GG9=?A@DC=;:?>839/4856
@Rosalind_0041
ATTCGGTAATTGGCGTGAATCTGTTCTGACTGATAGAGACAA
+
@DJEJEA?JHJ@8?F?IA3=;8@C95=;=?;>D/:;74792.
1
Programming Shortcut
When used to read FASTQ data, BioPython's function
SeqIO.parsereturns a SeqRecord object containing the Phred quality scores corresponding to each base of the sequence. The scores are found in the.letter_annotationsattribute, which is a Python dictionary having, in this case, a single key, 'phred_quality.'>>> print record.letter_annotations.keys() ['phred_quality'] >>> print record.letter_annotations["phred_quality"] [40, 39, 38, 37, 36, 35, 34, 13, 12, 11, 10, 9, 8]