Oct. 12, 2013, 6:34 a.m. by Rosalind Team
Topics: Graphs
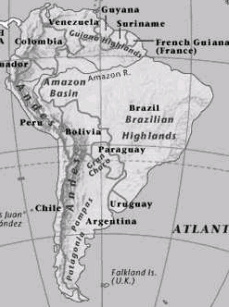
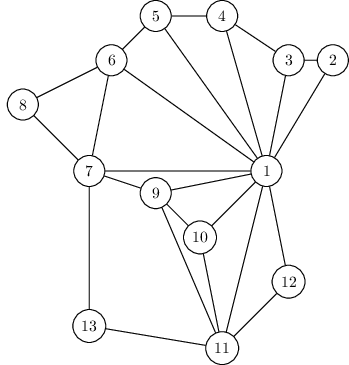
A wide range of problems can be expressed with clarity and precision in the concise pictorial language of graphs. For instance, consider the task of coloring a political map. What is the minimum number of colors needed, with the obvious restriction that neighboring countries should have different colors? One of the difficulties in attacking this problem is that the map itself, even a stripped-down version like Figure 1, is usually cluttered with irrelevant information: intricate boundaries, border posts where three or more countries meet, open seas, and meandering rivers. Such distractions are absent from the mathematical object of Figure 2, a graph with one vertex for each country (1 is Brazil, 11 is Argentina) and edges between neighbors. It contains exactly the information needed for coloring, and nothing more. The precise goal is now to assign a color to each vertex so that no edge has endpoints of the same color.
Graph coloring is not the exclusive domain of map designers. Suppose a university needs to schedule examinations for all its classes and wants to use the fewest time slots possible. The only constraint is that two exams cannot be scheduled concurrently if some student will be taking both of them. To express this problem as a graph, use one vertex for each exam and put an edge between two vertices if there is a conflict, that is, if there is somebody taking both endpoint exams. Think of each time slot as having its own color. Then, assigning time slots is exactly the same as coloring this graph!
Formally, a graph is specified by a set of vertices (also called nodes)
Sometimes graphs depict relations that do not have this reciprocity, in which case it is
necessary to use edges with directions on them. There can be directed edges
Source: Algorithms by Dasgupta, Papadimitriou, Vazirani. McGraw-Hill. 2006.
In an undirected graph, the degree
Given: A simple graph with
Return: An array
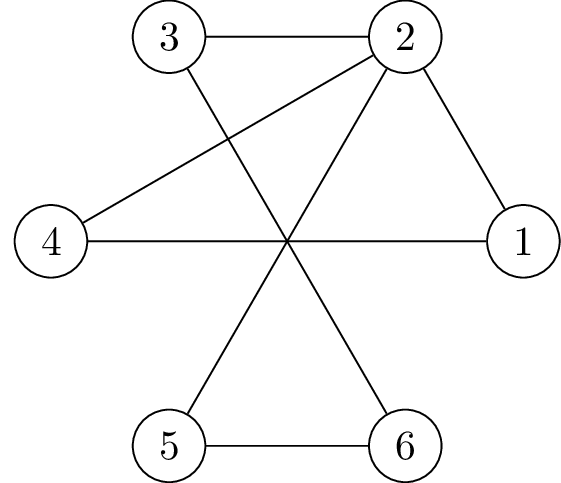
See Figure 3 for visual example from the sample dataset.
6 7
1 2
2 3
6 3
5 6
2 5
2 4
4 1
2 4 2 2 2 2