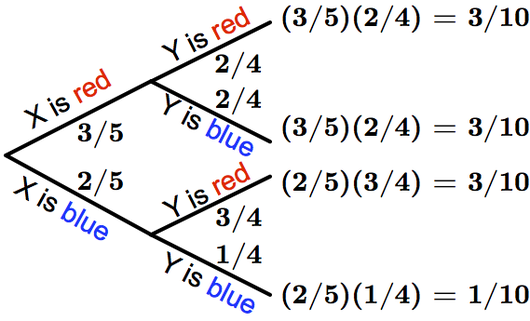
A branching diagram representing all outcomes of multiple random variables. The diagram
below is used for drawing two balls without replacement from a bag containing 3 red balls
and 2 blue balls. The color of the first ball is represented by the random variable